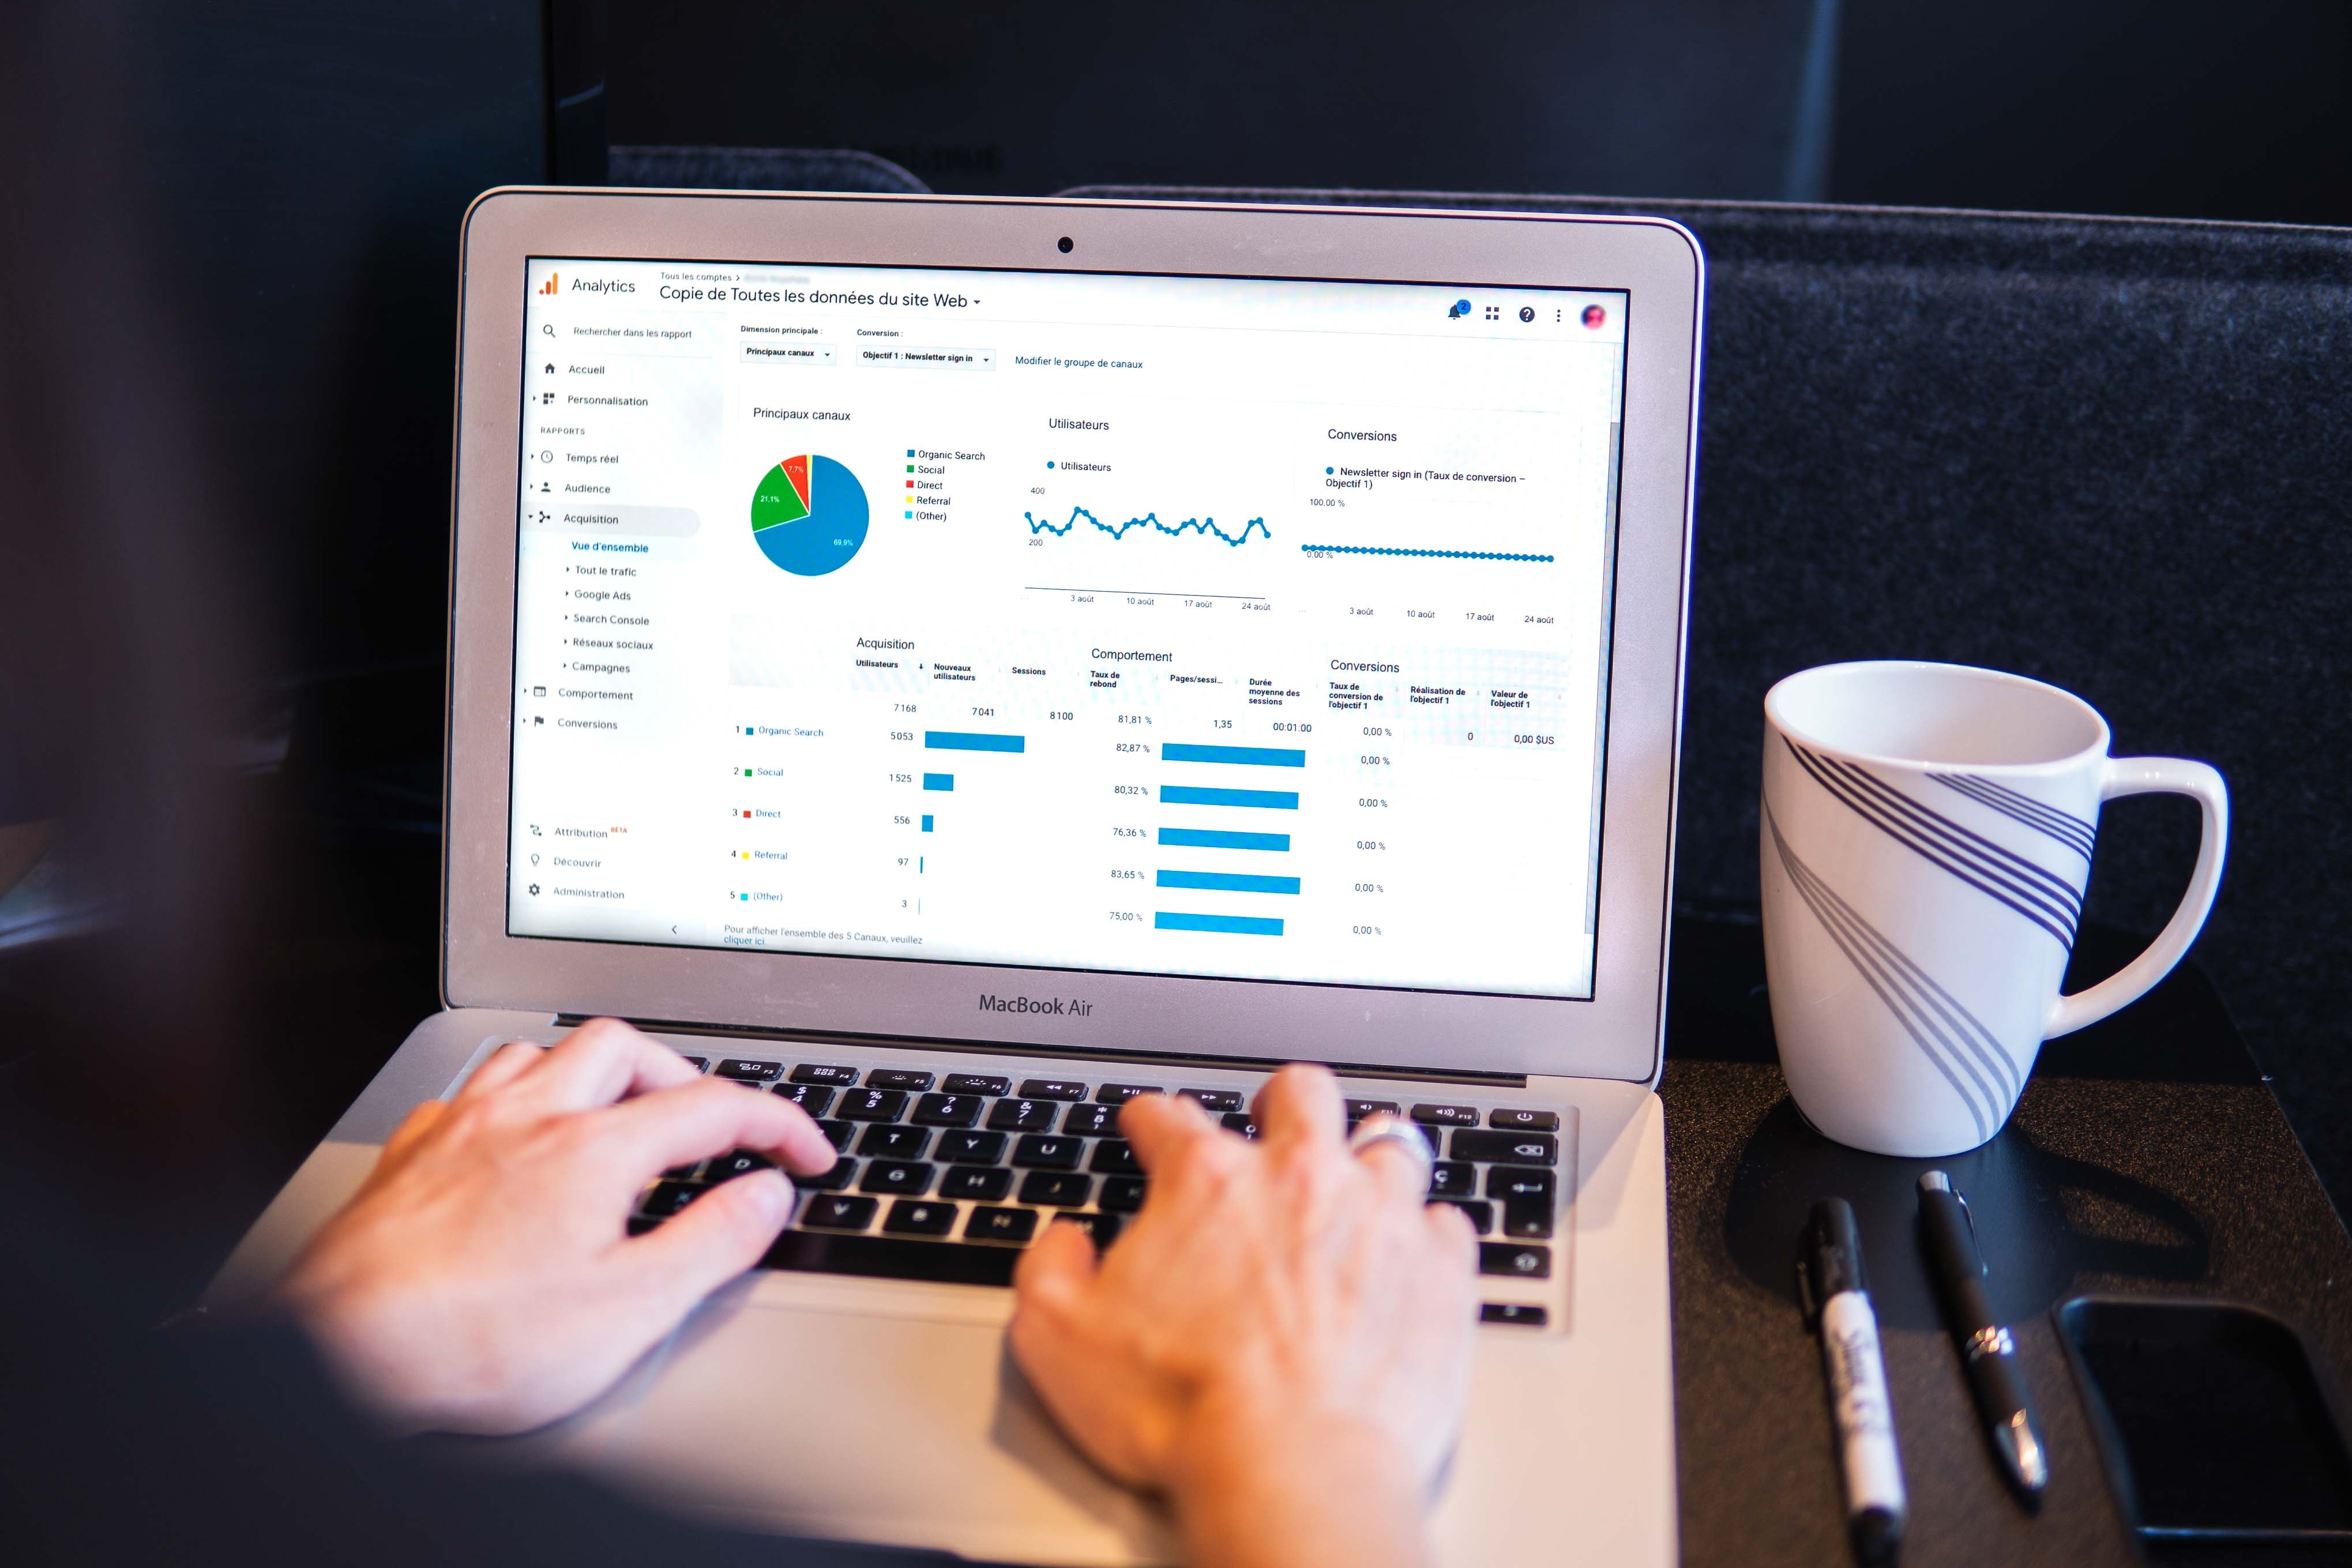
Connect Google Analytics and Unless
You can measure the success of your experiences using the Unless Insights while keeping an eye on the goals you've set and the audiences you are building.
However, if you want to dig deeper or simply prefer using Google Analytics as your single source of truth, you can do so. With this integration, you can deep dive into all the KPIs Google Analytics provides (e.g. bounce rate, time-on-page, exit page,...) and get an even better understanding of your Unless experiences with custom reports.
Simply navigate to the Integrations tab of your Unless dashboard, select Google Analytics, and toggle the switch to activate it. Unless will immediately start sending data to the Google Analytics account associated with your website - no need for additional setup.
Send events to Google Analytics
Once the integration is activated, Unless will automatically start sending events to Google Analytics. We'll send one event for each experience applied to the page, structured as follows:
- eventCategory: called "Unless - experiences"
- eventAction: equals the name of your Experience (e.g. "Headline test")
- eventLabel: equals "Participant" or "Control" or the variation name if applicable.
View Unless events in Google Analytics
To access information about your events, log in to Google Analytics, and navigate to "Behaviour → Events → Overview or Top Events".

Here you can add the segment "Unless Widget (Participants)" to see all events and Unless events specifically in one view.

If you click on the Event Category "Unless - experiences" you will see all the Event Actions in that category. In this case, that means seeing all your Unless Experiences, as shown in the screenshot below.

Google Analytics custom reports
You now know where to find Unless events in GA, how to view them, and get an overview of the insights associated. Let's move on to the real value of this integration with Google Analytics: custom reports.
"Google Analytics provides some great pre-configured reports to work with out of the box, but the ability to customize and build your own reports from scratch is what allows marketers to gain truly valuable insights from the tool." - Neil Patel
There are a number of insights that Unless provides you with. You can read more about that here. Then you have Google Analytics, where in most views you can add a secondary dimension for more granular insights.
And then you have custom reports where you can add even more. Think of all your accounts, properties, dimensions, filters. etc. They can all be selecting in a personalized way to create your very own data view that works best for you and your team(s).
If you are not familiar with custom reports or unsure where to get started, Google's own documentation is a good place to start. But we also recommend this article by Neil Patel as well as the Solutions Gallery by Google Analytics which contains custom reports created by others that you can install to your account.
Once you've installed these custom reports, you can go ahead and make adjustments to make them fit the needs of your business more specifically. Or you can make your very own custom reports from scratch. After all, that's the beauty of custom reports. They are specific to you, your business, and your metrics.
What metrics to measure with Google Analytics
Your goal is likely the main metric to determine the success of your experiences. However, Google Analytics is a great source for analyzing secondary performance metrics. Below are some common examples.
- Avg. Session Duration: How much time did people spend on my site? Did experiences increase session duration?
- Bounce Rate: How many visitors left after only looking at the entry page? Did experiences lower drop-off rate?
- Pageviews per Session: How many pages did people visit on average? In other words: did experiences grab their attention?
Then you also have metrics that are specific to your business. These could include transactions, revenue, average order value, product view, add to cart, subscription purchase, sign-ups, and more.
With custom reports you can see not just the effectiveness of an experience but the journey before, during, and after. Was the user part of the experience? How many sessions did they have? How many transactions followed this experience? and so on. All that provides you with a more comprehensive idea of your efforts and results.


