
Unless is currently developing a series of algorithms to predict the behavior of new, anonymous website visitors. The goal is to make websites scan and classify these visitors, so they can be served an individualized experience that fits their state of mind. Practical applications are easy to imagine. For example, if the predicted attention span of a website visitor is short, the user experience should be as efficient and quick as possible.
So, the attention span of users on the internet has been a topic of active interest since the advent of online advertising. In recent years, there is a growing concern that new technologies like smartphones and tablets can have detrimental effects on the attention span of people, especially adolescents and children.
But how do you predict something as intangible as attention span? Our data scientist Boyan Angelov explains! Warning: science ahead.
Breaking down the problem
We broke down this complex topic into several questions which can be answered with data science methods:
- Can we train a machine learning model to successfully predict the degree of attention span of a visitor?
- Can we determine the driving factors behind this prediction?
- Do those factors interact with each other - and if so, how?
Preparing the data
Before diving into heavy computation a best practice in machine learning is to do some Exploratory Data Analysis (EDA) and data processing. For the purposes of our experiments we took out a sample of 300000 website visits and their associated behavior.
One of the first challenges we had was to select the correct aggregation level which would correspond to an individual user. We decided on grouping those visits by session. A session is defined by the continuous period of user activity in the browser, where successive events are separated by no more than 30 minutes.
Defining attention span
As a next step we had to define how to represent attention span from our data. We could measure attention span by measuring attention, skipping, switching and multitasking. For potential data points, we can look at the following.
- Session length (number of pages visited in the session),
- Time between visits in the session (more time means less skipping),
- Screen size (when in “lean-forward” viewing mode, like on a mobile phone, people have 1.5X more attention than in “lean-back” mode, like on a laptop or even bigger screen - source: Google/Ipsos, “Video Mobile Diary,” U.S., 2017).
- Number of individualized experiences, viewed in the session (contextually relevant content means more attention)
- Number of times the visitor is switching away from the view (a small number means less multitasking),
- Maximum scroll position of visits in the session (more scrolling means more attention),
- Average scroll speed of visits in the session (slow means less skipping),
- Number of up and down scroll movements of visits in the session (small means less skipping).
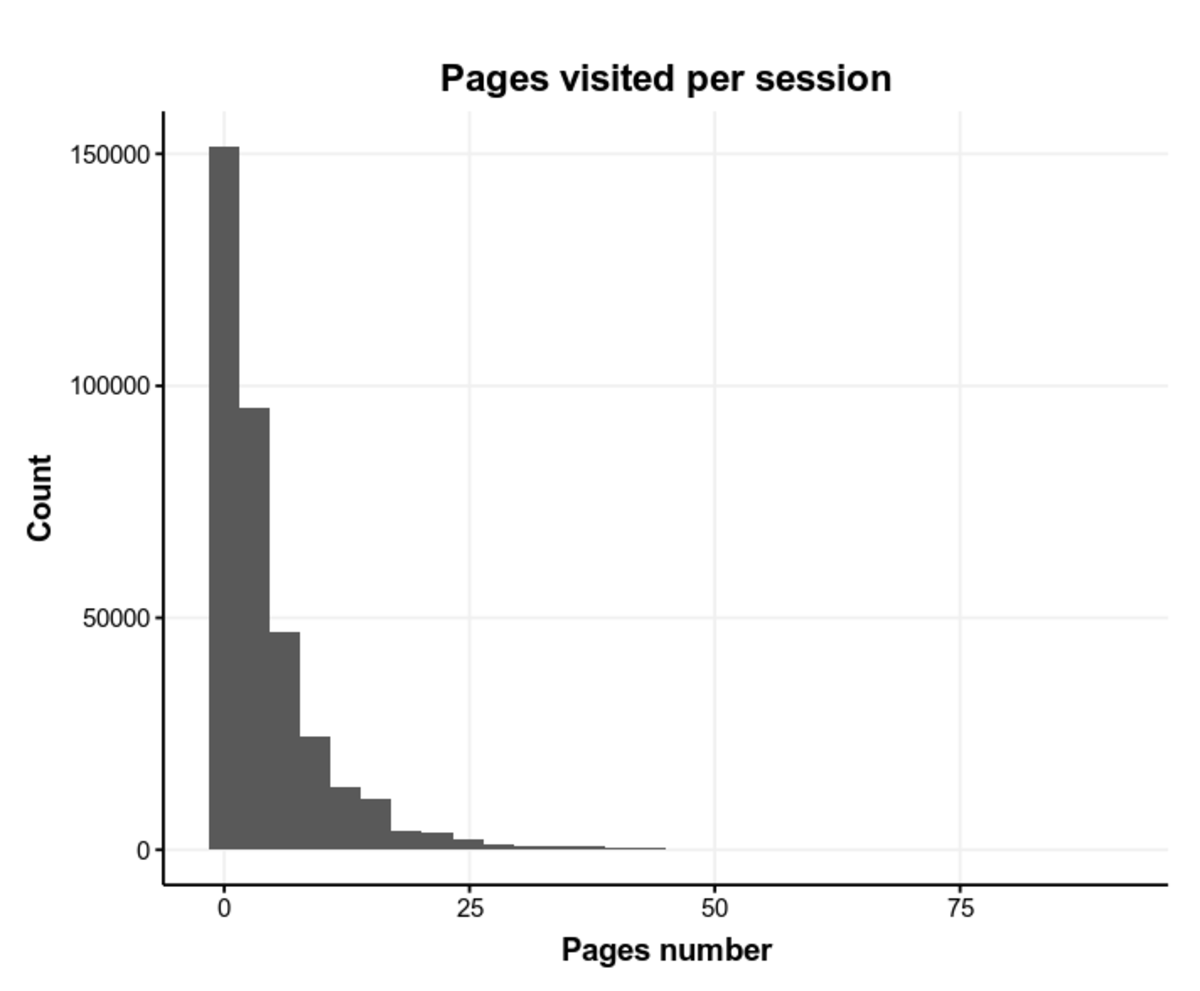
For simplicity’s sake, we assume here that the best initial abstraction is the number of pages visited per session (in reality, there are way more indicators, such as average time spent per page per user, viewport switching rate and other things). The assumption is that people who have a lower attention span would visit a lower number of pages.
Below you can find a histogram of pages visited per session, with outliers removed.
Supervised learning
So, session length will become the target variable in our supervised learning model. One of the best definitions of supervised learning can be seen from the blog at Machine Learning Mastery:
Supervised learning is where you have input variables x and an output variable Yand you use an algorithm to learn the mapping function from the input to the output.
Y = f(x)
The goal is to approximate the mapping function so well that when you have new input data (x) that you can predict the output variables (Y) for that data.
This is how we used the average number of pages visited per session x to construct our target Y:
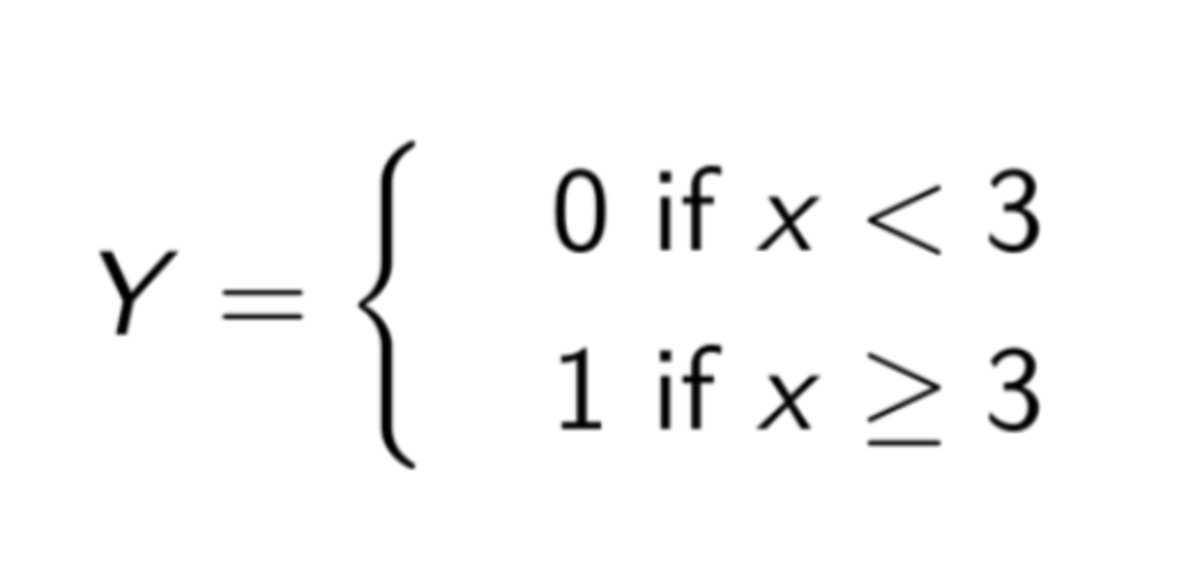
The “0” label became low attention span (i.e. less than 3 pages visited per session), and “1” became high attention span. As to what features we selected, we will present a more detailed list in a future blog post, where we will dig into much deeper detail.
For classification tasks on a structured datasets, extreme gradient boosting has become the de-facto gold standard. This algorithm has been immensely successful in a variety of tasks on the machine learning competitions platform Kaggle, and is well known not only for its accuracy, but also for its speed. We have tested a variety of other algorithms (including Random Forests and deep neural networks), but on this dataset they were outperformed by XGBoost. Here is a good summary from the project website:
XGBoost is an optimized distributed gradient boosting library designed to be highly efficient, flexible and portable. It implements machine learning algorithms under the Gradient Boosting framework. XGBoost provides a parallel tree boosting (also known as GBDT, GBM) that solve many data science problems in a fast and accurate way. The same code runs on major distributed environment (Hadoop, SGE, MPI) and can solve problems beyond billions of examples.
Evaluating the classifier
So how do we know that our classifier worked? A standard way to evaluate supervised learning algorithms is to test them on an unseen dataset (the data has been split into train and test datasets). Then we can evaluate the model predictions with the ground truth and see how well they performed. Below, we present a confusion matrix for our classifier:
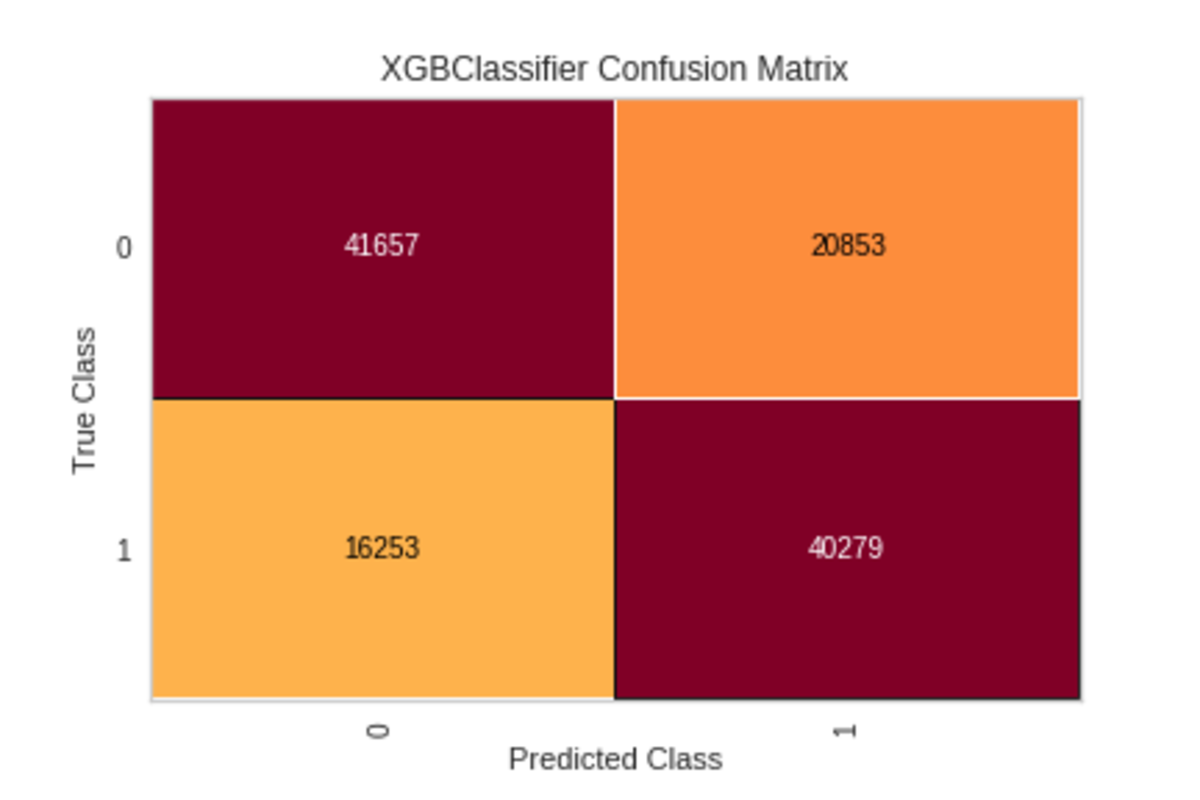
A confusion matrix is a table that is often used to describe the performance of a classification model on a set of test data for which the true values are known. The interpretation of the confusion matrix becomes easier after getting familiar with the two types of possible classification errors. Type I (false positives) and Type II (false negatives). A good explanation is available here.
Additionally, this is our ROC-AUC curve:
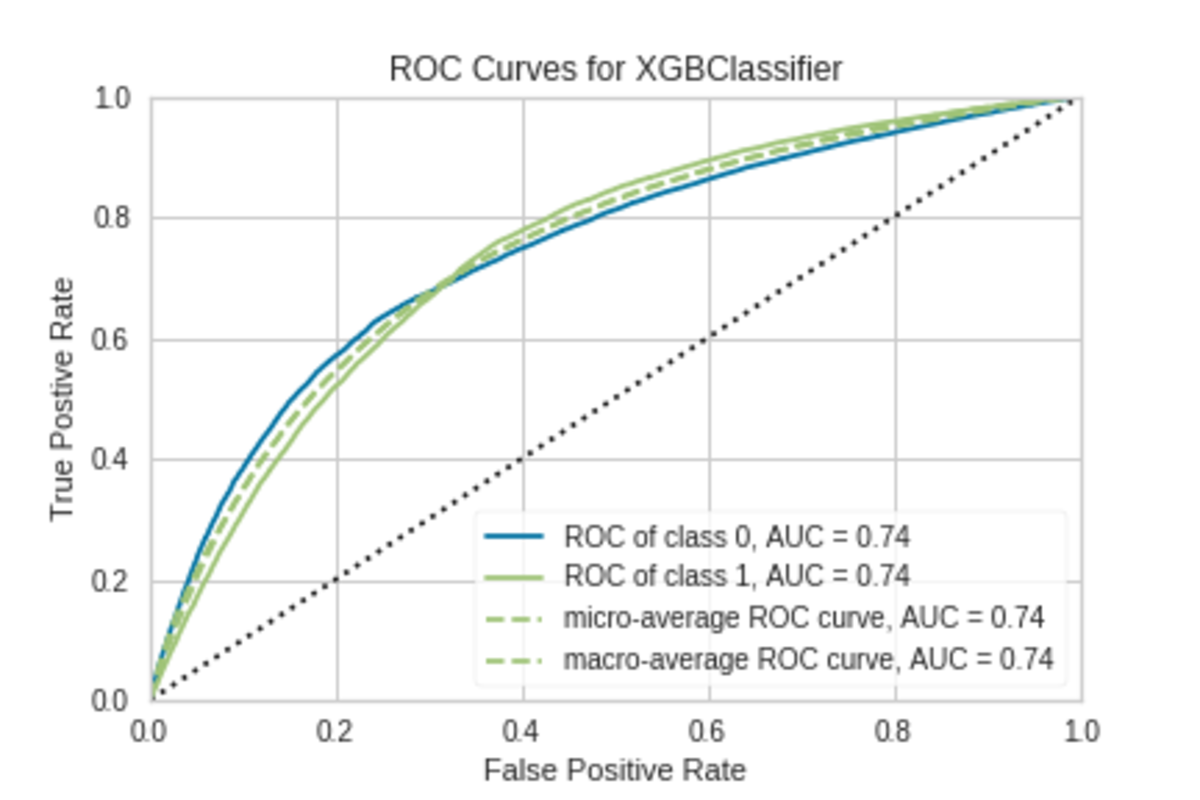
As for the ROC AUC curve, we are aiming to maximise the area below it. Higher AUC - better model and vice versa.
The results so far
From those results we can see that our initial classifier performed relatively well on the task. Of course there is room for improvement, and there are a few additional steps we might try and implement. But for now this model will be sufficient for us to dig deeper into what actually drives attention span.
We will provide you with more insight on the topic in part II of the series, where we will dig deeper into the real factors behind attention span on the web!
More reading on attention span
For more reading, check Wilmer, H. H., Sherman, L. E., & Chein, J. M. (2017), "Smartphones and cognition: A review of research exploring the links between mobile technology habits and cognitive functioning", Frontiers in Psychology, 8(APR), 1–16. https://doi.org/10.3389/fpsyg.2017.00605